New Report: Discover key insights from over 5 million interactions
Download NowNew Report: Discover key insights from over 5 million interactions
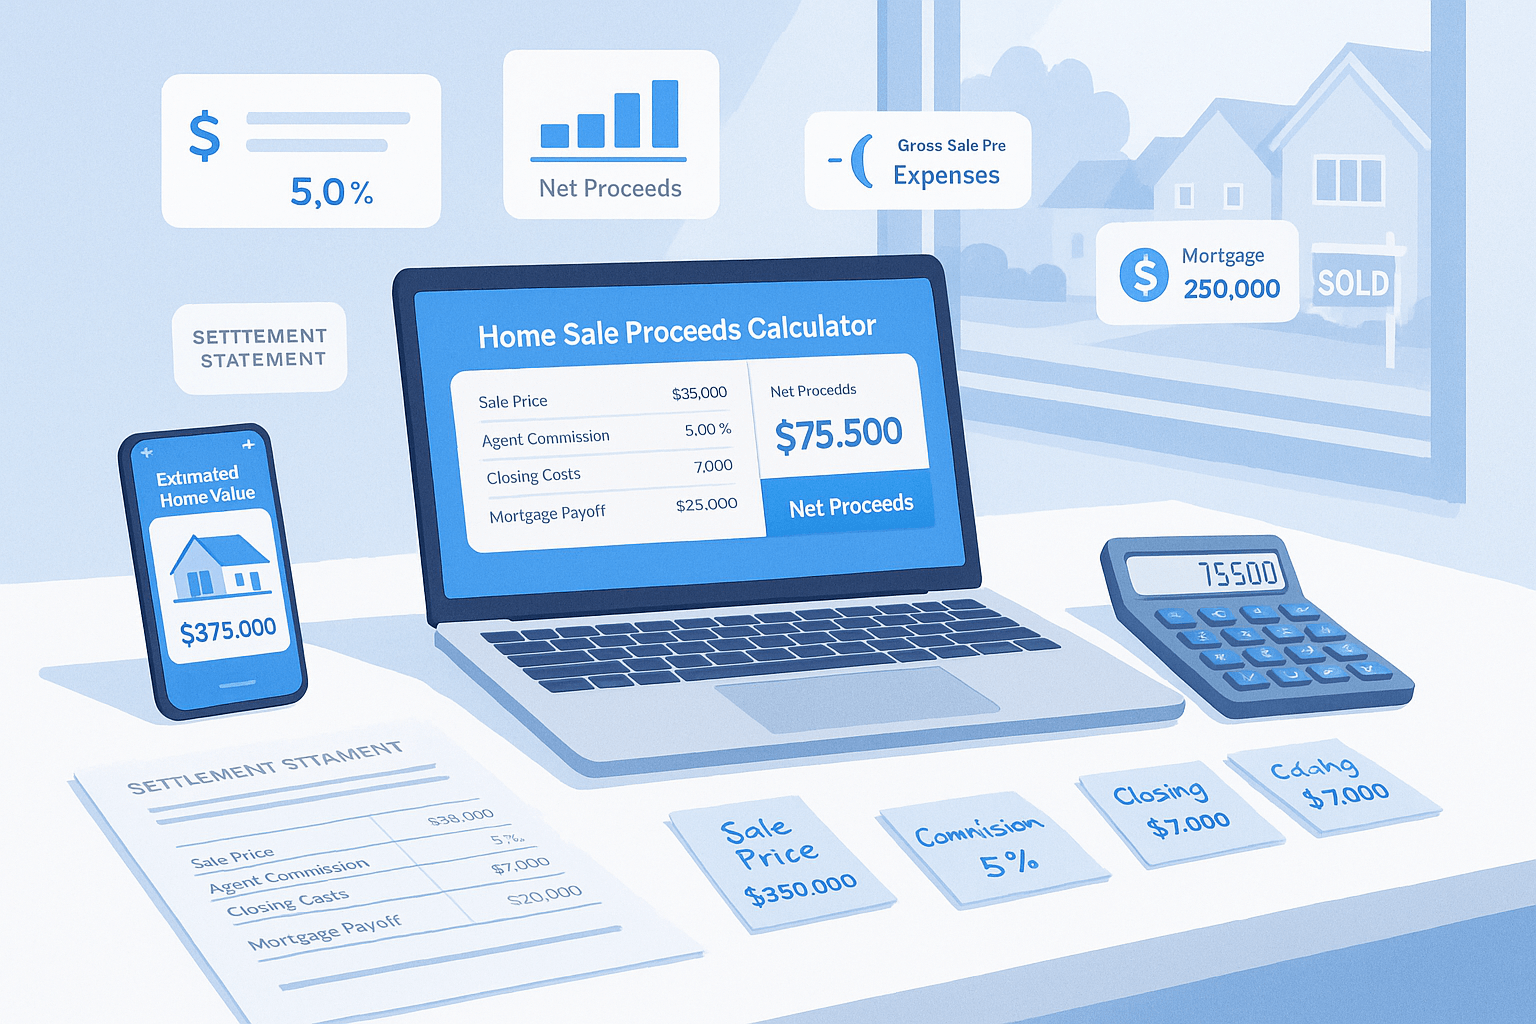
Download NowRent vs own analysis compares your total net worth after renting and investing your down payment versus buying a home over a specific time period. It shows which choice builds more wealth.
Rent Scenario = Investment Growth - Total Rent Paid Own Scenario = Home Equity - Total Payments Made
For example over 10 years:
Renting Often Wins When:
Buying Often Wins When:
Start with the home you're considering buying:
Find a comparable rental property:
Configure your investment strategy:
Review both scenarios:
The calculator assumes 3% annual home appreciation, which is close to the long-term average. However, real estate markets vary greatly by location and time period.
Conservative investors should use 6-7%, moderate investors 7-8%, and aggressive investors 8-10%. Historical stock market average is around 10% but includes significant volatility.
This simplified calculator doesn't include mortgage interest deductions or property tax deductions, which can favor homeownership for higher-income earners.
If you can't afford 20% down, adjust the percentage. Remember that lower down payments mean PMI costs, which aren't fully captured in this basic calculator.
The calculator assumes static rent, but real rents typically increase 2-3% annually. This generally favors the buying scenario over longer time periods.
The calculator doesn't include buying/selling costs (typically 6-8% of home value). For short time periods, these costs often favor renting.
Buying typically wins when you'll stay 7+ years, home prices are reasonable relative to rent (price-to-rent ratio under 20), and you have stable income for payments.
Renting typically wins for short stays (under 3 years), very expensive housing markets, or when you can invest the down payment at high returns with low risk.
Don't let another potential client walk away because you weren't available to respond instantly. Madison's pricing is designed to pay for itself with just one additional deal per month.

Explore what Realty AI can do for your business
By contacting us you agree to both our privacy policy and our terms and conditions
