Housing Market Indicators: Why Buyer Conversations Move Before the Sales Data
Most housing market indicators tell you what already happened: a deal went firm, a price got recorded, and a report came out weeks later. Buyer conversations show demand while it is still forming, and in 2025 they tracked the Canadian market's turns as they happened.
NNathan SmithPublished Sep 10, 2026Updated Sep 10, 20269 min read
Agents, brokers, and economists read the same market signals, and nearly all of them look backward.
The useful question is whether any signal shows where demand is heading while you can still act on it.
We analyzed more than 31,000 real estate conversations on Canadian agent, team, and brokerage websites in 2025 to test that idea.
Here is what we will cover:
A note on the source: the data comes from an real estate chatbot that answers visitor questions on real estate websites, with every conversation anonymized and analyzed only in aggregate.
Let's get started.
What Are Housing Market Indicators?
Housing market indicators are data points that describe supply, demand, and prices in a real estate market. In Canada, the most-watched ones come from CREA, local real estate boards, CMHC, and the Bank of Canada.
Here are the core indicators at a glance. The leading and lagging labels are general rules of thumb, not fixed laws.
A lagging indicator confirms a trend after it happens, while a leading indicator moves before the trend does. Sales and prices lag because they record deals negotiated weeks earlier.
Rates, listing ratios, and sentiment surveys lead because they shape decisions that haven't closed yet. The U.S. formalizes this with its Pending Home Sales Index, which counts signed contracts and generally leads existing-home sales by a month or two.
Even that index starts at a signed contract. By then, the buyer has already searched, toured, and decided.
Every Official Number Starts at a Signed Deal
The earliest official reading of a buyer's decision arrives months after that buyer started looking. That delay is built into how the data is collected, not a flaw in any one report.
Two numbers show the size of the gap:
The search itself: the typical U.S. buyer searched for 10 weeks before buying, based on NAR's survey of 6,103 buyers who purchased between July 2024 and June 2025.
The reporting delay: CREA publishes each month's national sales in the middle of the following month. December 2025 figures came out on January 15, 2026.
If Canadian buyers search about as long as U.S. buyers, a decision can take three to four months to show up in national statistics.
Conversation data fills that gap, because it records the question, the budget, the timeline, and the location on the day the buyer types it.
What 31,000 Buyer Conversations Showed in 2025
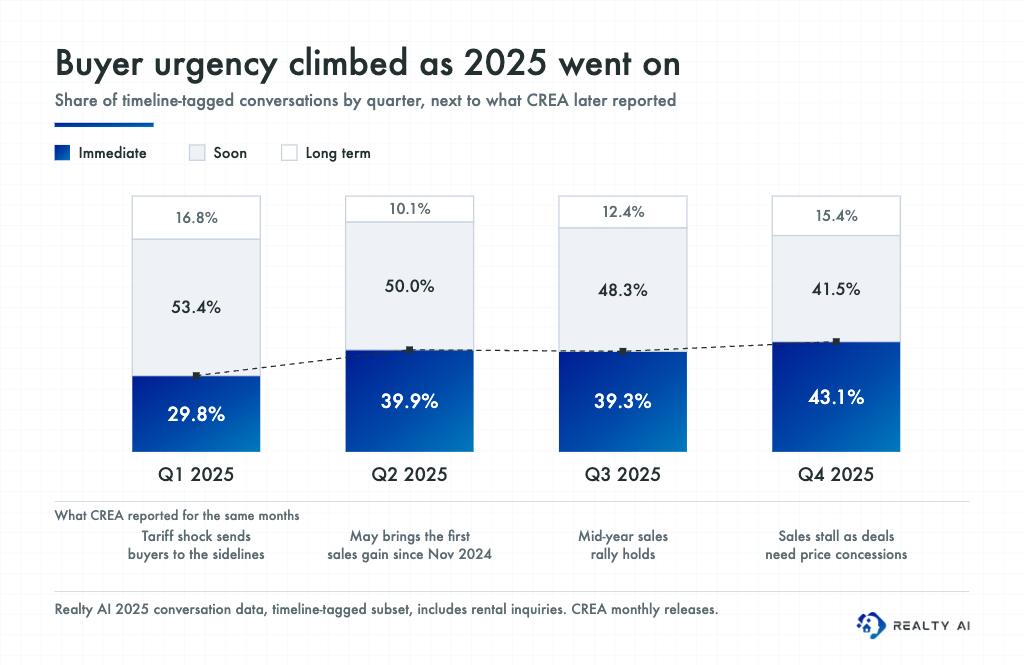
The share of people describing an immediate need to act rose from 29.8% in Q1 to 43.1% in Q4. The biggest move came in spring, when immediate urgency jumped 10 points between Q1 and Q2.
Here's how that lines up with what CREA reported for the same periods:
Quarter
Immediate
Soon
Long term
What CREA reported
Q1 2025
29.8%
53.4%
16.8%
Tariff shock sent buyers to the sidelines
Q2 2025
39.9%
50.0%
10.1%
May sales rose 3.6%, the first gain since November 2024
Q3 2025
39.3%
48.3%
12.4%
Mid-year rally continued
Q4 2025
43.1%
41.5%
15.4%
Sales stalled, with price concessions to close deals
The edge was timing, not prediction. Spring urgency was visible in conversations as it built, while official confirmation of May's turn arrived on June 16.
“
The edge was timing, not prediction.
The mix of who was asking also shifted. Buyers grew from 62.8% of conversations in Q1 to 70.2% in Q4, while renters fell from 20.3% to 15.2%, a steady pull toward ownership.
Conversations also revealed how far along people were.
Over 72% of location-specific questions named an exact address or a neighbourhood, which no sales count can tell you.
What the Research Says About Early Buyer-Intent Data
Two studies tested early-funnel housing data, and both found it improves forecasts. Neither used chat data, but both measured the same idea: activity before the deal predicts the deal.
Online searches beat the experts. A model built on housing-related Google searches predicted U.S. home sales 7.1% better than a conventional baseline and beat NAR's own expert forecasts by 23.6%.
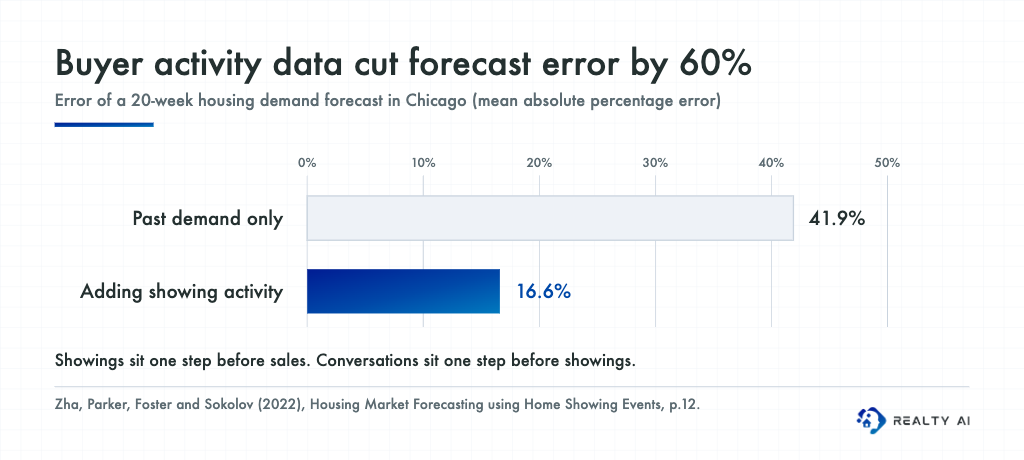
Showings cut forecast error by 60%. Using 7 million showing records in Chicago, adding showing activity lowered the error of a 20-week demand forecast from 41.9% to 16.6%.
The search study used U.S. data from before 2013, so read it for the lesson rather than the exact figures.
One detail still stands out: a one-point rise in searches about real estate agents was tied to 3,520 more home sales the next quarter in the average U.S. state.
That maps closely to conversation data, where agent contact was the second-most common topic in 2025. Searches show interest and showings show intent, and conversations sit between them with something neither has: the buyer's own words.
Where the Conversation Signal Fell Short
Q4 2025 was the real test, and the result was mixed. Immediate urgency hit its high for the year at 43.1%, yet national sales slipped 0.6% in November and 2.7% in December.
CREA noted price concessions in November to get deals done before year-end. That fits a smaller pool of more urgent buyers, not a broad rally.
Then 2026 opened weakly. March sales were flat after a mid-month jump in fixed mortgage rates, and CREA cut its 2026 sales forecast.
Four lessons came out of that miss:
Share isn't volume. A rising share of urgent buyers can come from a shrinking pool of buyers.
No indicator sees shocks that haven't happened yet. The March 2026 rate jump came months after the Q4 reading.
Renters blur the urgency series. The 2025 timeline data includes rental inquiries, which move on a different clock.
Quarterly data can't prove a lead of weeks. A monthly urgency series, limited to buyers and tested against CREA's seasonally adjusted monthly sales, can.
That last point matters for anyone citing this data. Treat conversation urgency as an early read on direction, not a forecast of volume.
“
Treat conversation urgency as an early read on direction, not a forecast of volume.
How to Read Buyer Intent in Your Own Market
You don't need 31,000 conversations to use this idea, just consistent tagging of the inquiries you already get. Track a few signals weekly and compare them with your board's monthly numbers.
Signal
What to track
What it tells you
Timeline
Share of immediate vs. long-term buyers
Whether decisions are speeding up or stalling
Location precision
Share naming an address or neighbourhood
How far along buyers are
Budget
Most-requested price band
Where demand is concentrating
Topic mix
Financing questions vs. listing-detail questions
Affordability pressure vs. active shortlisting
Buyer vs. seller share
Seller share by month
An early read on new listings
Start by asking every inquiry the same timeline question, the way you would when you qualify a real estate lead. Consistent questions turn scattered conversations into a trend line.
Watch for divergence between your signals and the official data. If urgency rises while your board's sales stay flat, it often points to a supply or financing bottleneck, and that's the moment to adjust your pitch.
Location precision also tells you where to invest. When most questions name neighbourhoods, a neighbourhood-level MLS location page meets buyers where they already search.
FAQ
What are market indicators in real estate?
Market indicators are measurable signals of supply, demand, and price, such as home sales, the MLS Home Price Index, the sales-to-new-listings ratio, days on market, and mortgage rates.
Most describe completed deals, so they confirm trends rather than anticipate them.
What is the best leading indicator for the housing market?
Among official data, the sales-to-new-listings ratio is the most widely used early signal for Canadian prices.
Buyer-intent data, including searches, showings, and website conversations, moves even earlier because it captures decisions before any contract is signed.
What is the hardest month to sell a house?
Canadian activity is strongly seasonal, and winter is usually the slowest period, which is why CREA reports seasonally adjusted figures.
In our 2025 data, Q1 had the lowest share of buyers ready to act immediately, at 29.8%.
Are Canadian house prices expected to fall?
In April 2026, CREA forecast a 1.5% rise in the national average price for 2026, to $688,955. Forecasts change often and vary widely by city, so check your local board and speak with a qualified professional before making financial decisions.
How far ahead can conversation data see demand?
Our 2025 quarterly data shows conversations moving with the market and becoming visible weeks before official releases.
Measuring an exact lead time requires monthly data, and the showing study above found activity data useful for forecasts up to 20 weeks out.
The Bottom Line
Nearly every housing market indicator reports a decision after it's made. Buyer conversations capture that decision while it's forming, so read them for direction, alongside the official data rather than instead of it.
The best time to sell a house in Canada is spring, but October is a close second. See what 2025 sales and 31,000 buyer conversations reveal about fall.
More than half of real estate website contacts arrive when the office is closed. We analyzed 72,580 conversations across 491 sites to find out when, and what it costs.
About Madison
The AI assistant built for real estate lead gen
Madison is Realty AI's conversational assistant for real estate websites. It engages visitors instantly, qualifies buyers, sellers, and renters through natural dialogue, routes summaries to your CRM, and keeps your team focused on closing.
5.0 average from 2,500 customer reviews
“We captured 3 new transactions worth over $3.3 million in just a few months using Realty AI.”
Sarah Logue
Broker & Owner, Top 0.1%
“Within our first week of using Realty AI, I had an engaged seller ready on the phone. This has never happened before in 4 years.”
Mark Jensen
Owner & Broker of Record
“It feels like having a personal assistant on my website 24/7, sending me instant notifications so I never miss a potential client.”